Gas prices this week: $4.36 national average as oil erases its 'energy ceasefire' dip
Oil prices fell overnight after President Trump wrote on Sunday that Russia and Ukraine had agreed to an "energy ceasefire". The drop did not last: by Monday morning in the U.S., Brent was about 2% above Friday's close. At the pump, almost nothing has moved. AAA's national average for regular is $4.356, one cent below a week ago, and the EIA's latest weekly figure is $4.354. A wholesale gasoline drop from late September is still working its way through, but our analysis of the EIA's data shows it reaches the pump slowly: about a fifth in the first week, about 70% after four weeks.
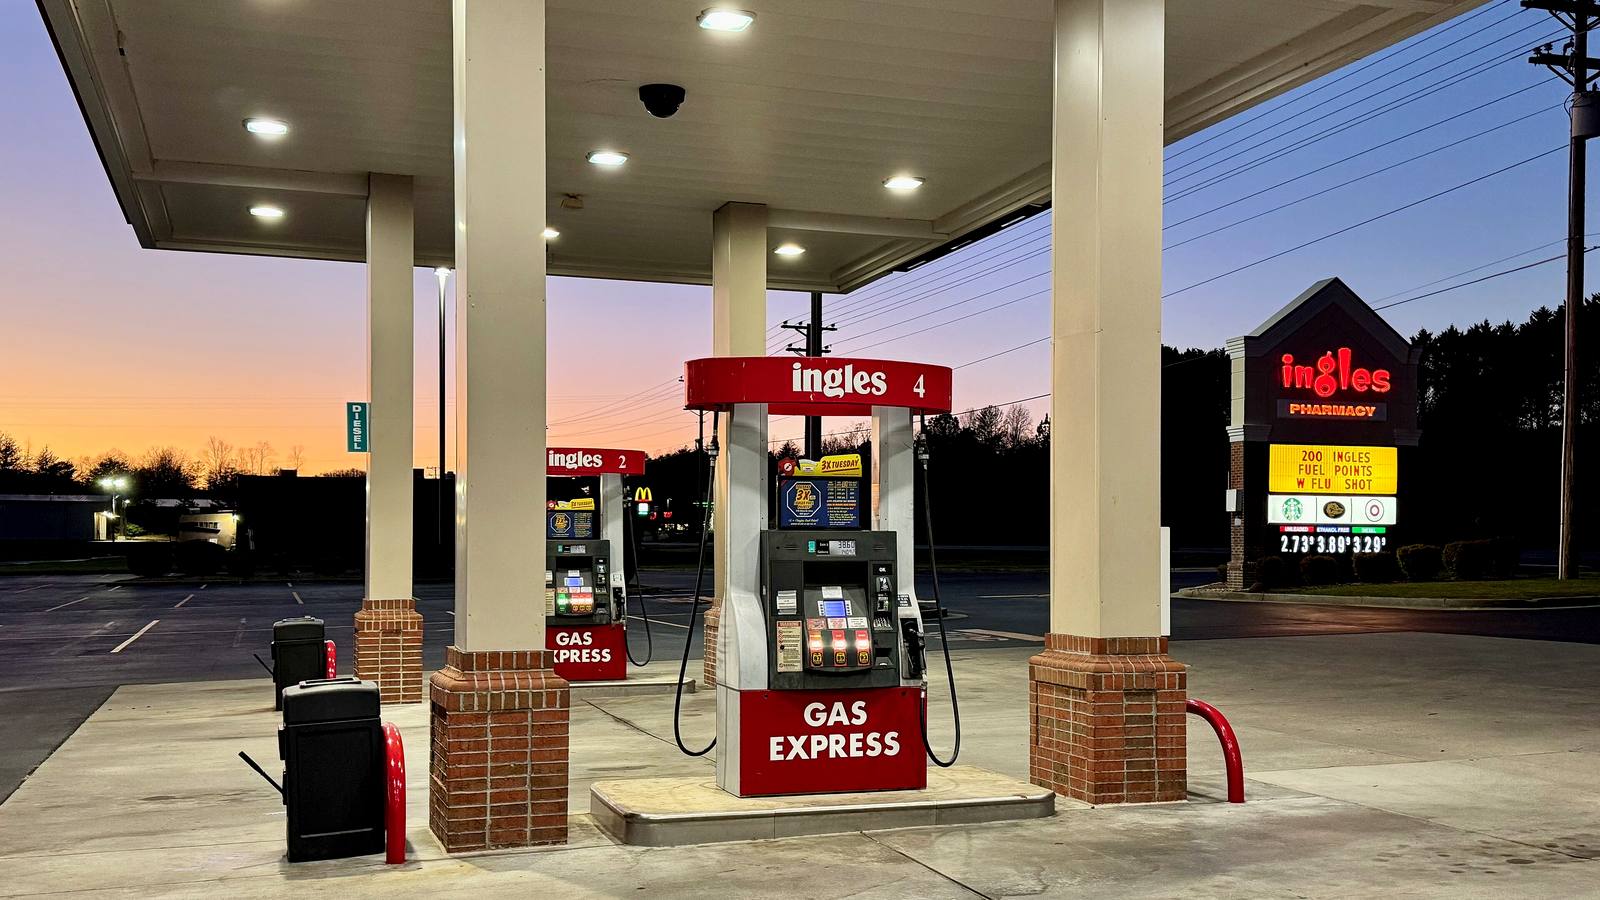
Will gas prices go down this week?
Probably by a few cents at most, and not because of the "energy ceasefire". The oil drop it caused lasted a few hours, while the wholesale drop from late September is already reaching the pump slowly.
On Monday, October 12, AAA's national average for regular is $4.356 a gallon, against $4.365 a week ago and $4.310 a month ago. A year ago it was $3.083. Filling a 15-gallon tank costs about $65, roughly $19 more than in October 2025. AAA says this is the first year the national average has been above $4 in October.
The U.S. Energy Information Administration's weekly survey, the figure this site publishes, put regular at $4.354 for the week of October 5, down 11.1 cents in a week and 12.4 cents below the $4.478 of September 21. Because of the Columbus Day holiday, the EIA's next weekly price comes on Wednesday, October 14, not Monday.
Wholesale gasoline started falling before the ceasefire post. On the Gulf Coast it went from $4.126 a gallon on September 23 to $3.564 on October 6, according to the EIA's spot prices, a drop of 56 cents. The pump has given back much less of that so far, and the next section explains why.
AAA national average for regular, October 12; $4.365 a week ago
AAA national diesel average, down 5.4¢ in a week; the record was $6.529 on September 21 (EIA)
Gulf Coast wholesale gasoline, September 23 to October 6 (EIA spot prices)
the EIA's forecast average for regular from October to December, in its outlook of October 6
What the 'energy ceasefire' is, and what it did to oil
The announcement was a social media post about Russia and Ukraine, not the Middle East. It targets attacks on refineries, which matter most for diesel.
On Sunday, October 11, President Trump wrote on Truth Social: "Effective immediately, there is an ENERGY CEASEFIRE in the War between Russia and Ukraine." He added: "Both parties have agreed." The post gave no details and there is no White House document on it. A White House official told Axios that the proposal is "refinery for refinery", meaning each side would stop striking the other's oil refineries. Moscow has not confirmed an agreement, and Ukraine says it supports a ceasefire but is waiting for details, and reported new Russian strikes on its power plants after the post.
The link to fuel prices runs through diesel. Ukrainian drone strikes have taken a large part of Russia's refining capacity offline, and Russian diesel exports fell from about 706,000 barrels a day in January to almost nothing in September, according to Kpler data reported by The National. Two days before the post, on October 9, the Treasury issued General License 135, which authorizes the sale, delivery and importation, "including importation into the United States", of diesel fuel of Russian origin until 12:01 a.m. on April 7, 2027. The President said Russia would supply more than 300,000 tons of diesel immediately, 500,000 tons in November and 1 million tons after that. UBS estimated the first batch at about 100,000 barrels a day for the rest of October; S&P Global analysts said the extra Russian cargoes would cover about a tenth of the global diesel export shortfall. We covered the separate diesel tax waiver in our red-dyed diesel guide.
Gasoline is affected only through crude oil, and crude is still dominated by the conflict with Iran that began on February 28. The EIA's latest outlook expects Brent to average about $105 a barrel from October to December. Our Strait of Hormuz tracker follows the flow of oil out of the Gulf.
| When | Brent | WTI | What moved it |
|---|---|---|---|
| Wed, Oct 7, settlement | — | $88.28 | WTI below $90 for a few days (AAA) |
| Fri, Oct 9, settlement | $104.72 | $91.85 | Hurricane Isaias in the Gulf; Russian diesel deal announced |
| Mon, Oct 12, Asian session low | $102.33 | $89.61 | Reaction to the "energy ceasefire" post |
| Mon, Oct 12, early Europe | about $104 | about $91 | Down 0.2% and 0.7% |
| Mon, Oct 12, 8:35 a.m. CT | $106.80 | $93.78 | New attacks in Saudi Arabia and on tankers near Hormuz; highest in nearly two weeks |
Futures prices, front month. Settlements of October 9 and the Asian session range as reported by Mitrade; early European prices and the 8:35 a.m. Central figures as reported by Oilprice.com; the October 7 WTI settlement from AAA. Intraday prices change by the minute; the Monday settlement was not yet available when we published.
How much a drop in oil takes off the pump price, and how long it takes
We measured it on the EIA's own numbers: weekly national pump prices against the Gulf Coast wholesale price of gasoline, every week since January 2015.
per gallon for every $1 a barrel change in crude, because a barrel holds 42 gallons
share of the retail gallon that was crude oil in May 2026; refining 22%, distribution and stations 15%, taxes 12% (EIA)
of a fall in wholesale gasoline that shows up in the national average the following week
of a rise that shows up the following week: in the first week, prices go up three times as fast as they come down
| Weeks after the move | Share of a fall at the pump | Share of a rise | A 40¢ wholesale drop becomes |
|---|---|---|---|
| 1 week | 20% | 60% | −8¢ |
| 2 weeks | 41% | 77% | −16¢ |
| 3 weeks | 55% | 76% | −22¢ |
| 4 weeks | 70% | 76% | −28¢ |
| 6 weeks | 81% | 78% | −32¢ |
| 8 weeks | 89% | 82% | −36¢ |
Our calculation: a regression of the weekly change in the EIA's U.S. regular gasoline price (all formulations, Mondays) on the changes in the EIA's Gulf Coast conventional gasoline spot price, weekly averages of the previous eight weeks, with rises and falls measured separately; 614 weeks, January 2015 to October 5, 2026; it explains about three-quarters of the weekly moves. The Gulf Coast is one wholesale market among several, so the shares are approximate and vary by region. The EIA reached a similar conclusion in 2005: retail prices start to reflect spot prices after about a week and take several weeks to catch up fully.
This year has already shown the pattern. Between May and June, as the U.S. and Iran moved toward their mid-June memorandum, Gulf Coast wholesale gasoline fell 72 cents, from a weekly average of $3.650 in the week to May 1 to $2.933 in the week to June 19. The national pump average fell almost exactly as much, 72 cents, from $4.500 on May 11 to $3.777 on July 6. It took eight weeks, and the pump bottomed out more than two weeks after wholesale did.
Why it is slow on the way down. Stations buy fuel by the truckload and price it against what they paid, and when wholesale falls they usually rebuild their margin before they cut. That margin is thin right now. The gap between the national pump price and the previous week's Gulf Coast wholesale price, which has to pay for taxes, transport to other regions and the station, was 68 cents on October 5 and 52 cents on September 28. Its average from 2015 to 2025 was 95 cents, and when wholesale fell in early June it widened to $1.16. A gap that low usually means part of the next wholesale drop stays with the station.
What that means now. Wholesale gasoline on the Gulf Coast averaged $3.672 in the week to October 2, down 27 cents from the week before, and was about $3.54 on October 5 and 6. Had it stayed there, the pattern above points to a national average around $4.15 by early November, close to the EIA's forecast of $4.15 for the fourth quarter. That is a projection from past behavior, not a forecast of ours, and it depends on oil not going back up. Since October 6, it has: crude rose with Hurricane Isaias in the Gulf of Mexico and the attacks in Saudi Arabia, and AAA's daily average has almost stopped falling.
Gas prices by state today, and what changed in a week
The national average hides big moves. Prices jumped in parts of the Midwest and fell in North Carolina, which stopped charging its state gas tax on October 10.
| State | Regular, Oct 12 (AAA) | Change in a week | EIA weekly, Oct 5 |
|---|---|---|---|
| Georgia | $3.805 | −4.4¢ | $3.959 (Lower Atlantic) |
| Texas | $3.819 | −8.7¢ | $3.874 |
| Ohio | $3.874 | −0.3¢ | $3.829 |
| Indiana | $3.907 | +16.6¢ | $4.109 (Midwest) |
| North Carolina | $3.913 | −11.4¢ | $3.959 (Lower Atlantic) |
| Florida | $4.068 | +0.8¢ | $3.970 |
| Iowa | $4.237 | +12.5¢ | $4.109 (Midwest) |
| New York | $4.455 | −1.9¢ | $4.380 |
| Pennsylvania | $4.463 | −1.7¢ | $4.363 (Central Atlantic) |
| Michigan | $4.656 | +20.0¢ | $4.109 (Midwest) |
| Illinois | $4.697 | +3.3¢ | $4.109 (Midwest) |
| Utah | $4.808 | −11.4¢ | $4.417 (Rocky Mountain) |
| Nevada | $5.445 | −3.8¢ | $5.116 (West Coast) |
| Washington | $5.449 | −3.6¢ | $5.424 |
| Hawaii | $5.625 | +0.3¢ | $5.116 (West Coast) |
| California | $6.308 | −8.4¢ | $6.227 |
AAA: daily state averages for regular on October 12, 2026, and change against AAA's week-ago figure. EIA: weekly survey for the week of October 5, as shown on our state pages; the EIA publishes its own average for nine states (California, Colorado, Florida, Massachusetts, Minnesota, New York, Ohio, Texas, Washington) and a regional average for the rest, named in brackets (West Coast here means West Coast excluding California). The two surveys use different station samples and days, so they don't match exactly.
Cheapest: Georgia ($3.81), Texas ($3.82) and Ohio ($3.87) lead AAA's list, with Indiana, North Carolina, Mississippi, Tennessee and Louisiana all below $3.94. On the EIA's weekly figures, the Gulf Coast is the cheapest region at $3.911. Most expensive: California at $6.31, then Hawaii, Washington and Nevada above $5.40. The West Coast was the only region where the EIA average rose last week.
The Midwest jumps are price cycling, not oil. Michigan rose 20 cents in a week and Indiana almost 17, while wholesale prices were lower. Stations in several Great Lakes states raise prices all at once and then let them drift down for days, so weekly changes there swing both ways. Over a month, Michigan is up 34 cents and Ohio down 30. Check the Midwest page and Chicago for the EIA's weekly figures.
North Carolina's tax holiday. Governor Josh Stein signed the Relief at the Pump Act on October 9, suspending the state's 41-cent tax on gasoline and diesel from October 10 through November 30, according to NC Newsline and WUNC. The 18.4-cent federal gas tax still applies. AAA's North Carolina average fell 11.4 cents in a week, to $3.91. Legislative leaders expect drivers to see closer to 30 cents than 41, and the law lets stations recover tax already paid on fuel in their tanks, so the full drop takes time. Our gas tax by state table shows each state's regular rate.
What could still push the pump price down, or back up
Four things to watch over the next two weeks, with the date when each one gets a new number.
Wholesale gasoline
The best guide to next week's pump price. Our wholesale signal showed Gulf Coast gasoline at $3.619 for September 30 to October 6, down 6% on the five days before: falling. The EIA publishes the next week of spot prices on Wednesday.
Crude oil and the Gulf
Brent is back above $105. The EIA expects about $105 for the quarter, and its outlook assumes Middle East flows stay below normal through the end of the year. Every $10 a barrel is about 24 cents a gallon, sooner on the way up than on the way down.
Hurricane Isaias and refineries
Before landfall, companies had shut in about 1.3 million barrels a day, roughly 63% of U.S. Gulf of Mexico oil output, as of October 8 (federal data reported by CNBC). Refineries near the storm's path, including Chevron's Pascagoula plant, have not reported their post-storm status.
Gasoline stocks
U.S. gasoline inventories were 204.7 million barrels on October 2, 14.4 million below a year earlier, and demand was 8.78 million barrels a day over four weeks (EIA). Low stocks make the pump price react faster to any refinery problem. The next report is on Thursday, October 15, delayed by the holiday.
Timeline: oil, the ceasefire post and the pump, updated October 12
Newest first. Times are U.S. Eastern unless stated.
- Thursday, October 15, noon (due)EIA Weekly Petroleum Status Report for the week to October 9: gasoline stocks, demand and refinery runs, a day later than usual because of Columbus Day.
- Wednesday, October 14 (due)EIA weekly gas and diesel prices for Monday, October 12, and the state pages on this site.
- Monday, October 12Brent swings from $102.33 overnight to $106.80 by mid-morning, its highest in nearly two weeks. AAA: regular $4.356, diesel $6.267.
- Sunday, October 11President Trump posts that Russia and Ukraine have agreed to an "energy ceasefire". A White House official describes it to Axios as "refinery for refinery". Moscow does not confirm.
- Saturday, October 10North Carolina's 41-cent state gas tax is suspended through November 30.
- Friday, October 9The Treasury issues General License 135 for Russian diesel, valid to April 7, 2027. Brent settles at $104.72, WTI at $91.85.
- Thursday, October 8About 63% of Gulf of Mexico oil output is shut in ahead of Hurricane Isaias. AAA: regular $4.361, "record highs for autumn".
- Wednesday, October 7WTI settles at $88.28. EIA: gasoline stocks 204.7 million barrels, 7% below a year earlier.
- Tuesday, October 6EIA: regular $4.354 for the week of October 5, down 11.1 cents; diesel $6.199. The EIA's outlook forecasts $4.15 for the quarter. Gulf Coast wholesale gasoline at $3.564.
- Wednesday, September 23Gulf Coast wholesale gasoline at $4.126, its September high.
- Monday, September 21Regular at $4.478, this autumn's peak so far; diesel at a record $6.529 (EIA).
Will gas prices go down?
This week's wholesale signal for gasoline, diesel and Brent, with its dates
Gas prices by state
Every state's weekly EIA average for regular and diesel, with its gas tax
Why are gas prices so high?
This week's gallon split into crude, refining, taxes and margin
Diesel prices this week
The national diesel average, region by region, after September's record
Strait of Hormuz oil flow tracker
Every dated estimate of the oil getting out of the Gulf
Gas tax by state
The part of the price that does not move with oil
Where these figures come from
Pump, wholesale and stock figures from the EIA and AAA; the license text from the Treasury; futures prices and statements as reported by the outlets named. The pass-through analysis and per-gallon figures are ours.
- U.S. Energy Information Administration, Gasoline and Diesel Fuel Update, release of October 6, 2026 (week of October 5; next release October 14) — eia.gov; weekly U.S. regular gasoline series — eia.gov
- EIA spot prices, U.S. Gulf Coast conventional gasoline, daily and weekly, to October 6, 2026 — eia.gov
- EIA Weekly Petroleum Status Report, release of October 7, 2026 (week ending October 2) — eia.gov; holiday release schedule — eia.gov
- EIA Short-Term Energy Outlook, October 6, 2026, Table 2 (energy prices) — eia.gov (PDF); what we pay for in a gallon, May 2026 — eia.gov
- EIA, This Week in Petroleum, "Retail Gasoline Prices Generally Follow Spot Price Changes", November 9, 2005 — eia.gov
- AAA national and state averages, October 12, 2026 — gasprices.aaa.com; "Pump Prices Remain at Record Highs for Autumn", October 8, 2026 — gasprices.aaa.com
- Office of Foreign Assets Control, Russia-related General License 135, October 9, 2026 — ofac.treasury.gov
- The President's post of October 11 and the diesel volumes announced on October 9, as reported by CBS News; the White House official's description to Axios, as reported by Oilprice.com
- Oil prices on October 9 and 12: Mitrade; Oilprice.com, 6:30 a.m. CT and 8:35 a.m. CT; Kpler, UBS and S&P Global figures as reported by The National
- Hurricane Isaias shut-ins, federal data as of October 8, as reported by CNBC
- North Carolina gas tax suspension: NC Newsline and WUNC, October 9, 2026
- State, region and city prices: this site's EIA-based pages, week of October 5, 2026 — where the numbers come from
Published
By Gas Price Radar newsroom
We publish the U.S. Energy Information Administration's weekly gas and diesel prices for every state, region and city, and we measure how changes in oil and wholesale prices reach the pump.
Sources: U.S. Energy Information Administration (Gasoline and Diesel Fuel Update of October 6, 2026; Weekly Petroleum Status Report of October 7; daily and weekly spot prices; Short-Term Energy Outlook of October 6), AAA national and state averages for October 12, 2026, and the Treasury's General License 135 of October 9. The President's post as reported by CBS News; futures prices as reported by The National, Mitrade and Oilprice.com on October 12. The pass-through figures are our own calculation on EIA weekly data from January 2015 to October 5, 2026; per-gallon and per-tank figures are ours too. Photo: Harrison Keely, CC BY 4.0, via Wikimedia Commons. How our prices work: Where the numbers come from.